Microdetermination of Fatty Acids by Gas Chromatography
and Cardiovascular Risk Stratification by the Blood Fatty Acid Profile
incl. the EPA+DHA Level or Omega-3 index
Rupp H, Rupp TP, Wagner D, Alter P, Maisch B.
Molecular Cardiology Laboratory, Department of Internal Medicine and Cardiology, Philipps University of Marburg, Germany.
Microdetermination of fatty acids by gas chromatography and cardiovascular risk stratification by the "EPA+DHA level".
Herz 2006;31 Suppl 3:30-49

published also in:
Cardiovascular Benefits of Omega-3 Polyunsaturated Fatty Acids
Maisch B, Oelze R
IOS Press, 2007
ISBN 1586037072, 9781586037079
It is our aim to help you to establish methods for measuring and standardizing the fatty acid profile (incl. the EPA and DHA level).
The complete fatty acid profile or fatty acid spectrum provides information beyond the EPA and DHA level.
Rupp H, Rupp TP, Alter P, Maisch B.
Can J Physiol Pharmacol. 2012;90:55-73  Open Access
Mechanisms involved in the differential reduction of omega-3 and omega-6 highly unsaturated fatty acids by structural heart disease resulting in "HUFA deficiency".


Rupp H, Rupp TP, Alter P, Maisch B.
Inverse shift in serum polyunsaturated and monounsaturated fatty acids is associated with adverse dilatation of the heart.
Heart. 2010;96:595-98
|
Microdetermination of fatty acids in blood by gas chromatography Extraction of lipids. Although
lipids can be extracted with a variety of organic
solvents, the most frequently used procedure
involves a mixture of methanol (MeOH) and
chloroform (CHCl3) introduced by Folch
et al. (1).
The extraction procedure for 12 samples and the
transesterification step requires 3.5 h and
involves the following steps (in italics for 12 20
µl blood samples): Prepare 0.005% BHT solution (5 µl BHT stock + 10 ml MeOH). 2. Prepare extraction solution according to Folch et al. (1) by mixing 1 ml MeOH/0.005% BHT with 2 ml CHCl3 ("Folch solution"; 3 ml MeOH/0.005% BHT + 6 ml CHCl3). 3. Prepare C17:0 internal standard (3.3 mg/100 µl) (by weighing y mg C17:0, calculate 100/3.3 *y µl). Dilute 1:10 with Folch solution (0.33 mg/100 µl) . Add 10 µl to each sample tube (each contains 0.033 mg C17:0). 4. Add 30x (v/w) Folch solution to sample in 1.5 ml Eppendorf tube (20 µl blood + 600 µl Folch). Vortex well; in case of whole blood, use ultrasonic bath for 5 min. 5. Leave for 30 min on ice, also a bench-top shaker can be used. Spin at 4000 RPM in a table-top centrifuge for 15 min at 4°C. 6. Transfer 400 µl of the organic phase to a new Eppendorf tube and mix it with 80 µl 0.9 % NaCl solution. Shake for 5 min and spin at 4000 RPM for 15 min at 4°C. 7. Recover the bottom phase by pipetting through the upper phase preferably with gentle positive pressure (gentle bubbling) thereby avoiding that the upper phase gets into the pipette tip. Do not withdraw more than 90% of bottom phase and do not withdraw the interface. Pipet into a reaction vial with gas-tight Teflon® lined screw cap (beware of plastic ware which slightly dissolves e.g. in CHCl3 and results in ghost peaks; typically various polysiloxanes are observed in GC/MS). Alternatively, glass-stoppered glass tubes can be used. 8. Evaporate the extract using a gentle stream of N2.
2. Dissolve residue (of above step 8) in 750 µl of 1:1 MeOH:toluene (10 ml). 3. Add 750 µl of 0.2 M KOH in MeOH. 4. Cap the vial and heat at 35°C for 15 minutes. 5. Cool to room temperature and add 1.5 ml 4:1 hexane:CHCl3 (16 ml hexane, 4 ml CHCl3), mix. 6. Neutralize by adding approx 100 µl 1 M acetic acid (you can monitor the pH by putting very small drops onto pH indicator paper). 7. Add 1.5 ml of quartz distilled water and shake until upper phase becomes clear. 8. Centrifuge at 2000 RPM in a table-top centrifuge for 5 min at room temperature. 9. Add upper phase to Eppendorf tube and let the solvent evaporate in a stream of N2, but do not evaporate completely. 10. Use 1 µl for injection into the gas chromatograph. Gas chromatography. For gas chromatography, a model 8610C gas chromatograph from SRI Instruments ( Methyl esters of fatty acids were separated on a SP-2560 fused-silica capillary column (100m x 0.25 mm x 0.2 µm film thickness) of Supelco (Sigma-Aldrich, St. Louis, MO, USA) for which a standard with 37 fatty acid methyl esters is available (Supelco F.A.M.E. Mix C4-C24, no. 18919-1AMP). Mead acid (C20:3n-9) was identified with the cis-5,8,11-eicosatrienoic acid methyl ester standard from Sigma (no. E6013). Currently, we use a Varian Saturn 2200 mass spectrometer linked to a Varian CP3800 GC for identifying minor fatty acids. Chemical ionization with acetonitrile permits detection of the MH+ in case of saturated fatty acids and among other ions the [M+54]+ ion (4). Chromatographic conditions:
column oven,140°C for 5 min, increase to 240°C at
a rate of 4°C/min, hold at 240°C for 20 min;
injector, 260°C; detector, 260°C; carrier gas,
hydrogen at 1 ml/min; split 1:10; fuel gas,
hydrogen at 30 ml/min, synthetic air at 300
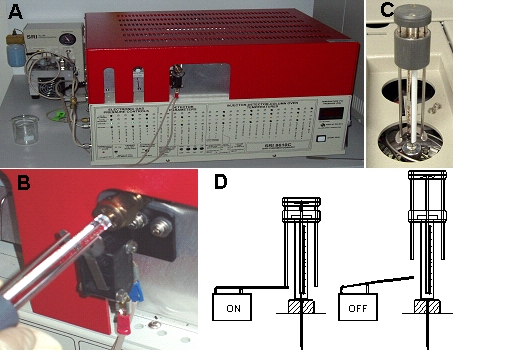
ml/min; total duration of run 45 min. Data
acquisition was synchronized with the sample
injection by using a mechanical device which
couples the injection with pushing the lever of a
microswitch resulting in its closure thus
providing the start signal (Fig. 1).
Contrary to some commercial systems, this
set-up monitors start of injection and not only
the syringe movement.
Figure 1. Gas
chromatograph model 8610C from SRI
Instruments (
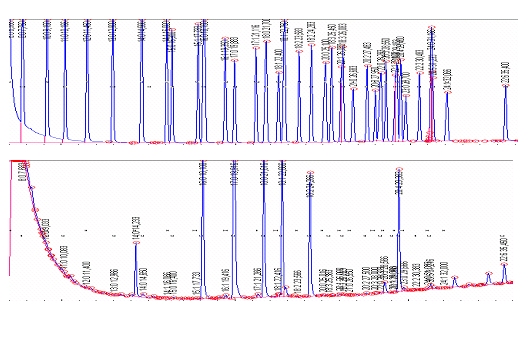
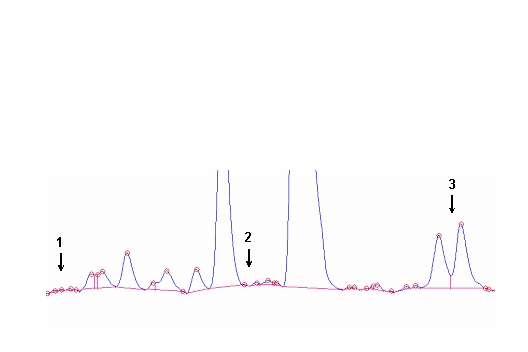
Figure 2. (Top) Gas chromatogram with 37 resolved fatty acids of a fatty acid standard (Supelco F.A.M.E. Mix C4-C24, no. 18919-1AMP). Arachidic acid (C20:0), arachidonic acid (C20:4n-6, cis-5,8,11,14), behenic acid (C22:0), butyric acid (C4:0), capric acid (C10:0), caproic acid (C6:0), caprylic acid (C8:0), cis-13,16-docosadienoic acid (C22:2), cis-4,7,10,13,16,19-docosahexaenoic acid (C22:6n-3), cis-11,14-eicosadienoic acid (C20:2n-6), cis-5,8,11,14,17-eicosapentaenoic acid (C20:5n-3), cis-8,11,14-eicosatrienoic acid (C20:3n-6), cis-11,14,17-eicosatrienoic acid (C20:3n-3), cis-11-eicosenoic acid (C20:1), elaidic acid (C18:1, trans-9), erucic acid (C22:1, cis-13), heneicosanoic acid (C21:0), heptadecanoic acid (C17:0), cis-10 heptadecenoic acid (C17:1), lauric acid (C12:0), lignoceric acid (C24:0), linoleic acid (C18:2n-6 cis-9,12), linolelaidic acid (C18:2, trans-9,12), γ-linolenic acid (C18:3n-6, cis-6,9,12), linolenic acid (C18:3n-3, cis-9,12,15), myristic acid (C14:0), myristoleic acid (C14:1, cis-9), nervonic acid (C24:1, cis-15), oleic acid (C18:1n-9, cis-9), palmitic acid (C16:0), palmitoleic acid (C16:1, cis-9), pentadecanoic acid (C15:0), cis-10 pentadecenoic acid (C15:1), stearic acid (C18:0), tricosanoic acid (C23:0), tridecanoic acid (C13:0), undecanoic acid (C11:0). (Bottom) Using this fatty acid standard, fatty acids are identified as shown for a representative fatty acid profile of blood cells after clotting.
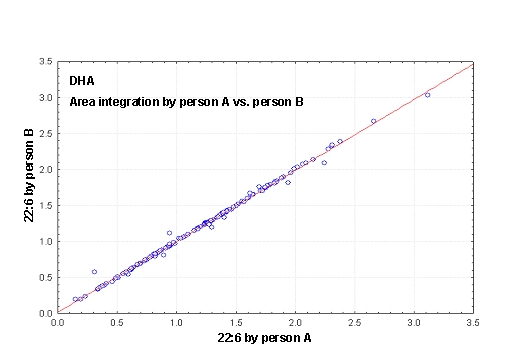 Figure 3. (A) Procedures for integration of fatty acids using the Peak Simple program. The arrows refer to rules described in the text. (B) Interobserver variabilities of percentage values of fatty acids determined independently by two persons. Monitoring the EPA+DHA level in whole blood after intake of EPA and DHA ethyl esters. We conducted a study in 11 normal healthy volunteers for monitoring the EPA+DHA level in whole blood after intake of 1g/day EPA and DHA ethyl esters (Omacor / Lovaza) (5). Whole blood had previously been used in the Physicians’ Health Study examining the interrelationship between risk of SCD and the level of omega-3 fatty acids (6). The EPA concentration increased from 0.6% to 1.4% within 10 days leading to a plateau value (Fig 4). DHA values increased from 2.9% to 4.3%. After Omacor® discontinuation, the values approached the pre-study level within 10 days, whereby the decline in DHA appeared to be less pronounced. The data show that within the present time scale of EPA and DHA ethyl ester administration, no EPA and DHA stores are formed in the body, which could maintain the blood EPA+DHA level after discontinuation of Omacor intake. 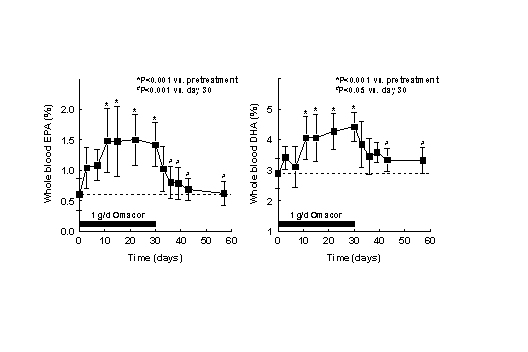
Figure 4. Whole blood
levels of EPA and DHA after 1 g/day Omacor administration
in normal healthy volunteers. Fatty acids were
extracted from 10 µl whole blood using the above
protocol. Omacor was purchased. Statistical
analysis was performed by repeated measures
analysis of variance and the Tukey-Kramer multiple
comparisons test using the "GraphPad InStat"
package ( 2. W.K. Fulk and M.S. Shorb. Production of an artifact during methanolysis of lipids by boron trifluoride-methanol. J. Lipid Res. 11 (1970) 276-277. 3. C. Stavarache, M. Vinatoru, Y. Maeda. Ultrasonic versus silent methylation of vegetable oils. Ultrason Sonochem 13 (2006) 401-407. 4. A.L. Michaud, G.-Y. Diau, R. Abril, J.T. Brenna. Double bond localization in minor homoallylic fatty acid methyl esters using acetonitril chemical ionization tandem mass spectrometry. Anal. Biochem. 307 (2002) 348-360. 5. H. Rupp, D. Wagner, T. Rupp et al. B. Risk stratification by the “EPA+DHA level” and the “EPA/AA ratio” focus on anti-inflammatory and antiarrhythmogenic effects of long-chain omega-3 fatty acids. Herz 29 (2004) 673-685. 6. C.M. Albert, H. Campos, M.J. Stampfer et al. Blood levels of long-chain n-3 fatty acids and the risk of sudden death. N. Engl. J. Med. 346 (2002) 1113-1118. For an overview on the concept
of the "EPA + DHA level" as related to
cardiovascular risk,
please see:
Rupp H, Wagner D, Rupp T, Schulte L, Maisch B. Risk stratification by the "EPA+DHA Level" and the "EPA/AA Ratio". Focus on anti-inflammatory and antiarrythmogenic effects of long-chain omega-3 fatty acids. Herz 2004; 29:673-685 (available as PDF) Rupp H, Rupp TP, Alter P, Maisch B. Acute Heart Failure – Basic Pathomechanism and New Drug Targets. Herz 2006;31:727-735 (available as PDF)   |
Omega-3test
"Make everything as simple as
possible, but not simpler."
Be more precise: the "EPA+DHA level" Not all omega-3 fatty acids are the same (see textbooks of biochemistry) and their protective effects depend on the chain length and number of double bonds. Only long-chain omega-3 fatty acids (EPA+DHA) but not the short-chain omega-3 alpha-linolenic acid have been shown to reduce risk of sudden death (Albert CM et al.). If e.g. the omega-3 level or omega-3 test would be calculated, obviously also the omega-3 alpha-linolenic acid has to be included (or you redefine what you mean with omega-3 and simply ignore textbook knowledge). Thus, terms like "omega-3 level" are too broad and not appropriate when referring to benefits observed in the GISSI-Prevention and GISSI-HF trials. Based on general biochemistry text books, the rational nomenclature should be: EPA+DHA level: sum of EPA and DHA Omega-3 level: sum of all omega-3 fatty acids incl. e.g. 18:3n-3 Omega-3 index: US trade mark of Omegametrix (07/2003-08/2005) refers to sum of EPA and DHA in red blood cells, does not include (as suggested by omega-3) other omega-3 fatty acids. A sum is typically not referred to as "index", e.g. there is no cholesterol index (e.g for sum of LDL-C and HDL-C) but there is the body mass index (i.e. a ratio). There is also a discrepancy between the design of well-controlled clinical trials and the inprecise specification of the medication used. The ratio of DHA:EPA in the GISSI trials was 1: 1.2. This ratio is found in Omacor / Lovaza, i.e. 38% DHA and 46% EPA. These prescription omega-3 fatty acid ethyl esters must not be referred to as "simple fish oil" and also not as "highly purified fish oil" or PUFA. Fish oil contains triglycerides whereas Omacor contains ethyl esters. Triglycerides but not ethyl esters are rapidly split by pancreatic lipase and thus rapidly absorbed. Ethyl esters result in a retarded sustained EPA and DHA absorption in the lymph. It should not be tolerated that the public is misled in this respect. Recent questions: Monitoring beyond omega-3 fatty acids? The arachidonic acid:EPA ratio needs to be re-evaluated. Gas chromatography How to work safely with hydrogen: use a hydrogen generator. Sample preparation and standardization Use alkaline conditions in the transesterification with methanol. The traditional BF3/method results in loss of EPA and DHA. Details are given in Rupp et al. Alternative tests Are the "fast" GC methods an alternative? Determination of Fatty Acid Methyl Esters by Ultra Fast GC: 20-fold Reduction in Analysis Time Automatic sample preparation with MPS-Prepstation from Gerstel |

A website maintained by Cardiorepair.com
Impressum:
rupp(at)cardiorepair.de
Google Scholar Citations of H Rupp
www.herzzentrum-marburg.de
www.herzzentrum.online.uni-marburg.de